
How tour operators can reconcile Google Ads with booking data
Google Ads cannot see every sale your website makes. In tourism the gap is big enough to change your decisions. This guide shows why the gap exists, how to measure it in an afternoon, and how to build a one-page dashboard that puts your ad spend next to your real bookings.
I have been running ads for tour companies for the past five years, and the same thing comes up in almost every account. What the ad account reports and what actually landed in the booking system are two different numbers. Bokun, Rezdy, Ventrata and the others have all been working on this, and it has improved. There is still a big difference.
Here is what that looks like in a real account.
A tour operator in London whose ads I run showed a reported 0.89x revenue-to-spend ratio over three months. That figure alone was a reason to investigate before making a budget decision.
Direct website revenue in the booking system divided by the same ad spend was 1.88x. That is a backend revenue-to-spend ratio, not corrected advertising ROAS. It includes direct website sales from other sources. The ratio between those two figures cannot tell us what percentage of paid bookings the conversion tag captured.
The comparison changed the questions I needed to ask. Were transactions missing, counted twice or attributed to a different period? How much demand came from organic search, repeat customers or other marketing? Backend sales provide essential context, but do not establish advertising profitability or causation on their own.
Why Google Ads misses sales your website actually made
For Google Ads to count a sale, two things have to work. A conversion tag has to fire when the booking completes, and Google has to be able to connect that booking back to a paid click. In tourism both halves break more often than people expect.
The main reason is where the payment happens. Most operators sell through a booking system like Bokun, Rezdy, Ventrata or FareHarbor. A customer clicks your ad, lands on your website, and then gets handed over to that system to pay. That checkout often sits on a different domain to your website.
Google can connect an ad interaction with a conversion using identifiers and other permitted measurement signals. A move to another domain, a misconfigured checkout or a consent choice can limit that connection. Test the complete booking journey under the relevant consent states and cross-domain settings; do not assume every unattributed booking came from an ad.
This is the part the booking systems have been working on. It still breaks often enough that you cannot assume yours is working.
Here is the rest of what I keep finding in real accounts.
- A booking engine that was never wired to the conversion tag at all
- Started checkouts counted as sales, so your conversion number looks far higher than the real one
- Bookings that complete days after the click, once you have stopped checking that week's numbers
Your business also takes bookings by phone, by email, and at the meeting point. A tag on your website cannot count any of those.
Step 1. Get the two numbers out
Two sources feed everything that follows. Google Ads on one side, your booking system on the other.
For Google Ads, do not start with the API. Start with a Google Ads Script. It runs inside your own account, so there are no credentials to set up and nothing to reconnect when access expires. You paste it in once and it writes to a Google Sheet on whatever schedule you set.
Here is one that pulls everything the dashboard needs, including ROAS and cost per conversion.
// Google Ads Script - exports campaign performance to a Google Sheet.
// Google Ads > Tools > Scripts > + New script. Paste this in,
// put your Sheet URL below, click Preview, then Run.

var SHEET_URL = 'PASTE_YOUR_GOOGLE_SHEET_URL_HERE';
var PERIOD = 'LAST_30_DAYS';   // or LAST_MONTH, THIS_MONTH

function main() {
  var sheet = SpreadsheetApp.openByUrl(SHEET_URL).getSheets()[0];
  sheet.clear();
  sheet.appendRow(['Campaign', 'Cost', 'Clicks', 'Conversions',
                   'Conv. value', 'ROAS', 'Cost / conv.']);

  var query =
    'SELECT campaign.name, metrics.cost_micros, metrics.clicks, ' +
    'metrics.conversions, metrics.conversions_value ' +
    'FROM campaign WHERE segments.date DURING ' + PERIOD;

  var rows = AdsApp.search(query);
  while (rows.hasNext()) {
    var r = rows.next();
    var cost = r.metrics.costMicros / 1000000;
    var conv = r.metrics.conversions;
    var value = r.metrics.conversionsValue;

    sheet.appendRow([
      r.campaign.name,
      cost.toFixed(2),
      r.metrics.clicks,
      conv,
      value.toFixed(2),
      cost > 0 ? (value / cost).toFixed(2) : 0,
      conv > 0 ? (cost / conv).toFixed(2) : 0
    ]);
  }
}
The API is the better long-term answer. It gives you far more fields, and it can push changes back into the account instead of only reading. It also needs a developer token, credentials, and reauthorising when the access expires. Get the script running first.
On the booking side, Bokun, FareHarbor, Ventrata and Rezdy all have an API, and all of them can also export a CSV. Start with the export. You need six fields from it: booking date, tour date, product name, channel, status and revenue.
A monthly export works the first time. Then someone forgets. Or exports the wrong date range. Or pastes a column one cell off. After a few months of that, the page is showing you numbers that are wrong. Once the numbers look right, set the script to run weekly and ask your booking provider about API access.
Step 2. Decide the one question you are answering
The dashboard has one job. You are paying Google to sell certain tours. The dashboard tells you whether those tours are selling more than before.
Sales move up and down with the season anyway, so a rise on its own does not tell you much. Here is what to compare it against.
- The same months last year. If you normally grow 20% in June and this June you grew 60%, something else is going on
- How big the jump is. A normal summer rise and a rise that arrived with the ads do not look the same
- A tour that barely sold before. If you start advertising it and bookings rise, investigate the timing alongside availability, price and other demand changes
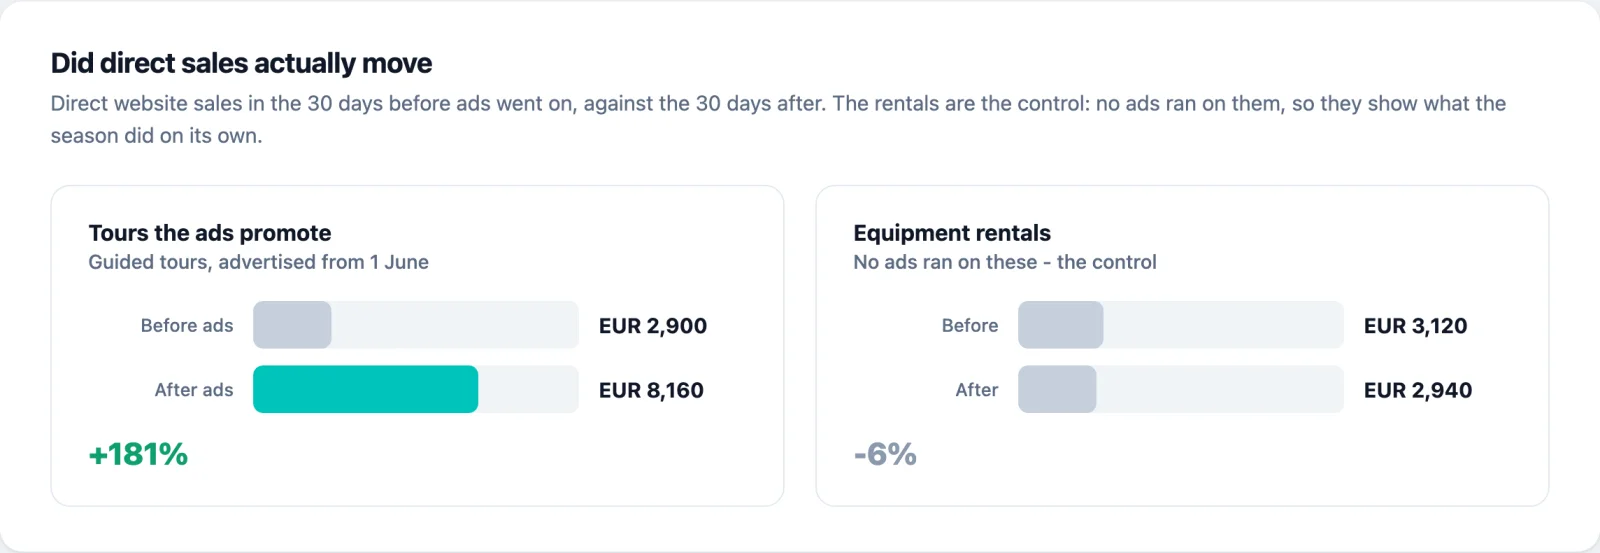
At one account the advertised tours went up while unadvertised rentals stayed flat. That was a useful observation, but different products may face different demand and availability. A comparison product needs similar underlying trends to be informative. If there is no suitable comparison, report that limitation instead of calling the change advertising lift.
Pick which of those three comparisons you are using before you open the data.
Step 3. Build the dashboard with four prompts
Four panels, and every one of them serves that single question.
Panel one shows platform-attributed ROAS beside direct website revenue divided by ad spend. Label the second number as a backend revenue-to-spend ratio. Underneath, explain that the two numerators cover different sets of sales; their ratio is not a tracking capture rate.
Platform ROAS: revenue attributed to Google Ads ÷ Google Ads spend.
Backend comparison: direct website revenue from every source ÷ the same ad spend.
The second ratio includes non-paid demand. Comparing these totals does not calculate a tracking capture rate.
Panel two is the before and after. Direct sales for the advertised products in the period before ads, against the period after. Next to it, the same comparison for the control product. Percentage change sits under each, so you can compare them without doing any maths.
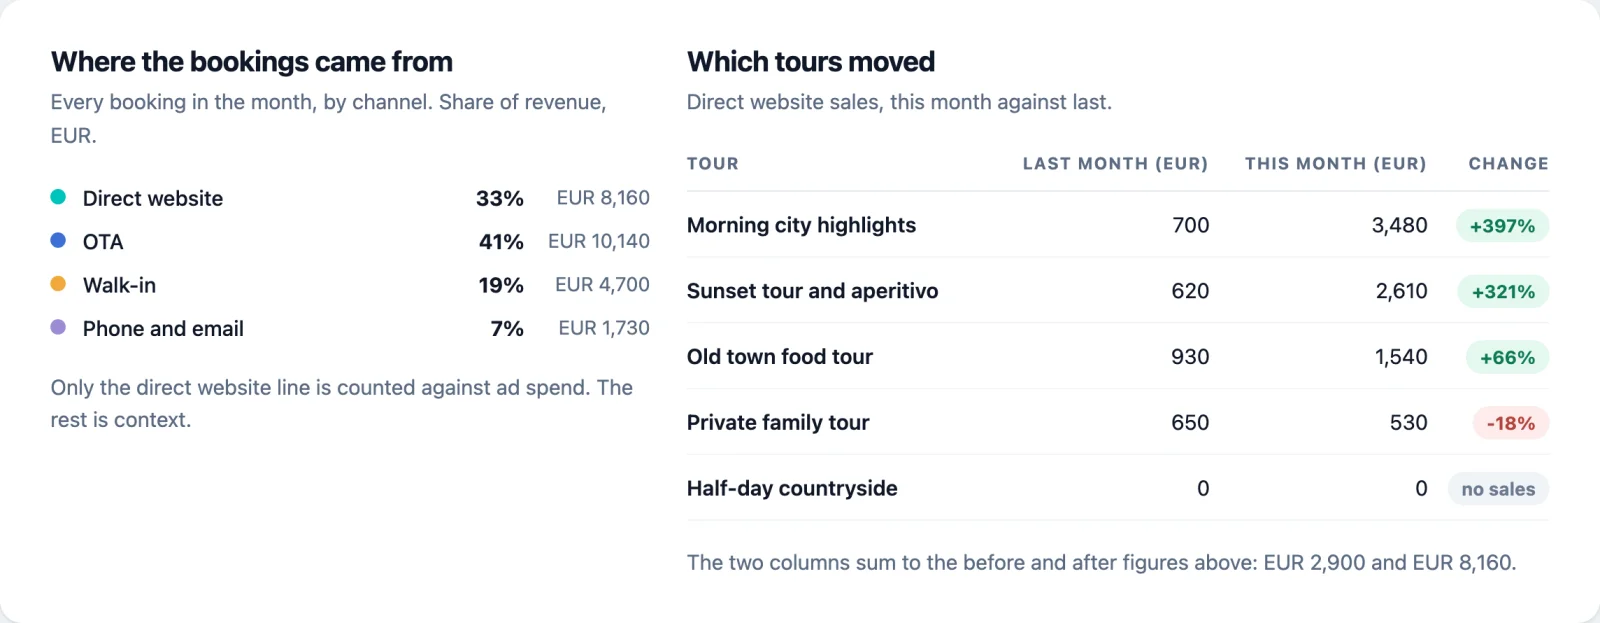
Panel three splits bookings by channel. Keep direct website revenue separate for the narrow comparison, and show total revenue divided by total ad spend separately if you also want blended MER. Neither ratio attributes every included booking to ads.
Panel four is a table of direct sales by product, this period against last, with the change. That table shows which tours sold more and which sold less.
Two small things to do every time. Put the currency on every number and the date range at the top of the page. If something on the page is an estimate rather than a real figure, say so right next to it. In three months you will not remember which numbers were real and which ones you guessed.
Here are the four prompts I used. Paste them in order into Claude or ChatGPT. Attach your two exports at prompt three. Prompt three is the one that builds the file.
I run a tour business. I want one dashboard that answers a single question:
how do platform-attributed sales compare with backend sales, and what
evidence could help assess whether advertising added demand?

I have two data sources:
- A Google Ads export: date, campaign, cost, clicks, conversions,
  conversion value, ROAS, cost per conversion.
- A booking system export: booking date, tour date, product name, channel,
  status, revenue.

Before building anything, tell me what you need from each file, what you would
put on the dashboard to answer that one question, and what you would leave off.
Ask me anything that is ambiguous.Now set the rules for what counts, and show them to me before you apply them.
- Which booking channels count as a direct website sale.
- Which products my ads actually promote, and which get excluded.
- What happens to cancelled, refunded and test bookings.
- Whether we count by booking date or tour date, and why.
- Which products can act as a control because no ads run on them.
List every rule as a line I can approve or change.Build the dashboard as one self-contained HTML file. No external libraries.
It must open in a browser by double-clicking it.
Four sections, in this order:
1. Two numbers side by side: platform-attributed ROAS and direct website
revenue divided by ad spend for aligned periods. Label the second as a
backend revenue-to-spend ratio. Explain that it includes non-paid demand.
Do not calculate a tracking capture rate from the ratio of these totals.
2. Direct sales for the advertised products in the period before ads against the
period after, next to the same comparison for a control product with no ads.
Show the percentage change under each. Label this as an observational
comparison, and list differences in demand, price, availability and
other marketing that could explain the movement.
3. Every booking in the period split by channel, with each channel's share.
Keep the direct-only comparison separate from blended MER. Neither ratio
establishes how much revenue the ads caused.
4. A table of direct sales by product, this period against last, with the change.
Label every figure with its currency. Put the date range in the header. If any
number is estimated or illustrative, say so on the page itself.
Tell me which products the ads ran on and when they started. Do not infer it
from the data.Before I trust this, audit it.
- Does the product table sum to the direct website channel total?
- Are cancelled and test bookings excluded everywhere, including the totals?
- Is anything double counted, for example a booking counted in two channels?
- Does the return I calculated match spend and revenue for the same date range?
- Which single number here is most likely to be wrong, and why?
Show me the arithmetic for each check.The output of prompt three is one HTML file. You double-click it and it opens in a browser. There is no server, no login and no monthly fee attached to it. If you would rather work from a finished template than start cold, message me and I will send you mine.
How to read it
Panel one identifies a reconciliation question. A gap can reflect different attribution rules, organic and repeat sales, date conventions, refunds or tracking faults. Reconcile comparable transactions and definitions before deciding whether measurement is broken. Similar totals do not prove the tracking is correct either.
Panel two gives directional evidence for a budget discussion. Advertised products rising while a comparable product stays flat is worth investigating, but does not establish causation. Seasonality, prices, capacity and other marketing can affect those products differently. A controlled experiment gives stronger evidence when feasible.
Panel three keeps the channel definitions visible. Walk-ins and OTA bookings belong in the business view. Keep them out of a ratio labelled direct website sales, and include them consistently if you calculate blended MER. Do not label either ratio incremental advertising return.
Panel four tells you which tour to look at next. A tour with live spend and no direct sales is an availability problem, a landing page problem, or a targeting problem. Start with the tour that dropped most, and check its availability and its landing page. Usually one tour is responsible for most of the drop.
Read them in that order: tracking, then sales change, then booking channels, then tours.
What this will not do
Five things it will not do for you.
The narrow comparison measures direct website sales. Advertising may also influence OTA or phone bookings, but this dashboard does not establish that effect. The OTA measurement guide explains how to investigate it and where stronger evidence is needed.
A rise after launch is not proof that the ads caused it. A mention in a guidebook, a hot week, a competitor selling out of their slots: any of those moves the same numbers. Treat a good result as a strong sign and keep checking it next month.
You have to decide this one yourself. What counts as a direct website booking depends on how your booking system fills that field. Nobody else can decide that for you. Decide the rule, write it down, and apply the same one every month.
It goes stale. Add a product, change your checkout, or move booking systems, and the rules from prompt two no longer match how you sell. Re-read the rules from prompt two every quarter. Correct the ones that no longer hold.
It does not fix your tracking or establish the amount missing from it. Transaction-level checks, consent and cross-domain testing, and a review of conversion settings are separate parts of the investigation.
Common questions
Why does Google Ads show fewer conversions than my booking system?
Your booking system counts sales from multiple sources, while Google Ads reports conversions under its attribution and conversion settings. Differences can also come from consent, cross-domain configuration, date conventions or missing events. Reconcile comparable records before concluding that the tag lost paid bookings.
Should I pause a campaign that shows a return below 1.0?
Investigate the reported result alongside backend sales, margin and measurement quality. The 0.89x platform ratio and 1.88x backend ratio in this example use different revenue definitions. Neither comparison alone proves whether the campaign is profitable or should be paused.
Do I need a developer for any of this?
No. The script runs inside your own Google Ads account, the booking export is a CSV, and the dashboard is one HTML file built by an AI assistant from the prompts above. It took an afternoon.
Run the script on your account this week. Pull the same month out of your booking system. Put the two numbers next to each other and see how far apart they are.
Whether the totals are close or far apart, check their definitions and reconcile a sample of transactions. Only then decide which measurement faults need attention and what the evidence supports about campaign performance.
A shorter version of this guide first appeared as an article on LinkedIn.
- What is a good ROAS for a tour operator?
- Can Google Ads lift your OTA sales? How to investigate the effect
- GA4 Source Groups and Hostname filters, and why clean data pays for itself
- MER vs ROAS: which number should you run the business on?
All guides live in the writing hub.
I am Kourosh. I work as a growth partner for tour and experience operators.
If your advertising reports and backend sales do not match, that is usually where I start.
For tour operators Book a call